ADRENA navigation software can read C-Map vector charts and Raster charts. Since version 12, it is now easy to integrate SnMap Raster charts from ScanNav.
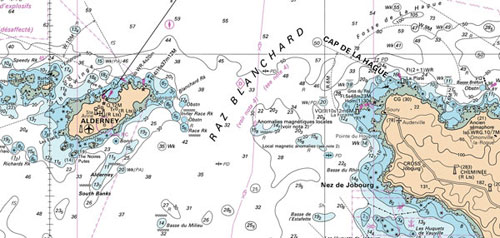
The Raster chart is an electronic version of paper charts issued from digitization and geographic referencing, without embedded intelligence. The advantage is that they are completely similar to paper charts, thus, the navigator who is used to this type of charts can easily read them.
In some areas in the world, they are available for free, directly provided by national hydrographic services (United States, New Zealand, Brasil…). On the European coasts, Raster charts are edited by private companies from data provided by national hydrographic services.
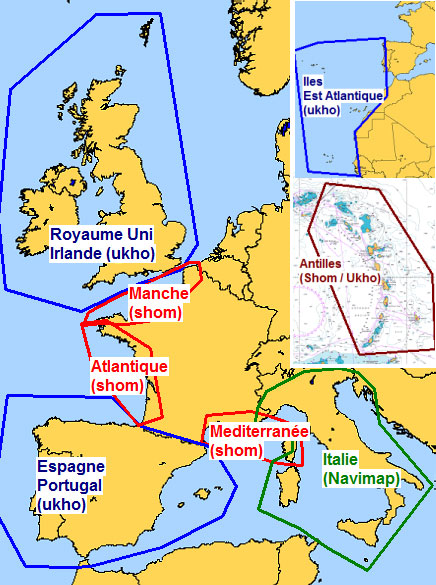
SnMap charts provided by Adrena cover the French coasts, Italy, Spain/Portugal, United Kingdom/Ireland, East-Atlantic Islands (Azores, Madeira, Canary Islands and Cape Verde) and Lesser Antilles.
Vector charts work differently since each element of the chart is given in an analytical way. For example, a line is limited to the 2 extreme positions, and this is the software which draws the line between the 2 points. Each element has a semantic, thus the software can use the information to add a function, like displaying/hiding lights sectors, defining dangerous areas according to sounding lines and even correcting sounding lines according to the tides (if it is explicitly required by the user).
3 types of Raster charts
Private companies, in particular Maptech, are editing Raster charts which are scanned from paper charts. The process can induce some distortions more or less significant depending on the quality of the original chart and of the scanner.
Official RNC charts are also scanned from paper charts by the UKHO. They include a quality control by the Hydrographic Services in order to ensure final product precision.
Finally, SnMap charts, read by Adrena software, are issued from the printing films that are used to print paper charts. These films are directly provided by the SHOM (or the UKHO depending on the area), which avoids manipulation errors and facilitates regular updates.
Charts update
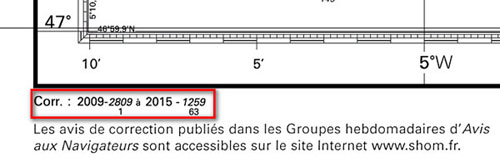
SnMap format was mainly created for technical needs of optimization in order to provide a quality chart with a low price. There are updated once to twice a year (in spring and autumn) with the last GAN corrections (SHOM’s notice to mariners publication) clearly indicated in the references.
However, hydrographic services do not provide quality control on the final product.
On the contrary, the update process of Maptech charts being very complicated, the follow-up on the European area is not ensured. This is why Adrena does not provide them anymore.
Chart quality
When we are sailing in unknown seas, it is important to keep in mind that the charts do not have the same quality all around the world. In Europe, we are lucky to have high-quality hydrographic services like the SHOM and UKHO. Thus, the reliability of the charts is very high on the European coasts. Unfortunately, this is not the case all around the world…
Even if improvements are noticeable, errors can still be present more or less significantly. Thus, it is important to know the degree of reliability that is allocated to a chart in order to adapt the navigation (scale and date of statement, provider authority, sounding lines technique…). This type of information is mentioned on paper chart cartridges (and thus on Raster charts). In Adrena, it is possible to display the chart cartridge as well as all the information about the paper chart by using the menu ![]() (display chart options) and by activating
(display chart options) and by activating ![]() (chart contour).
(chart contour).
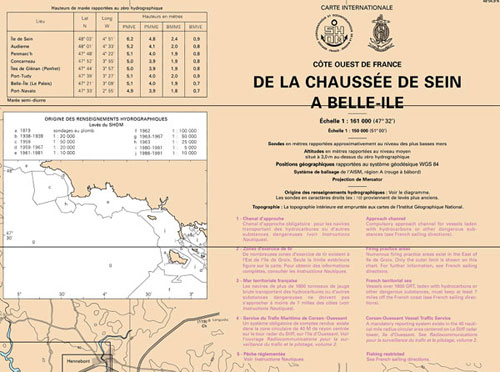
The precision of the hydrographic services data is not the same for all the coasts, thus it is also very important to check the original scale of the chart.
Chart precision : Raster vs. Vector
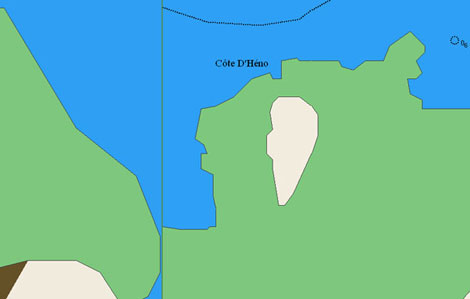
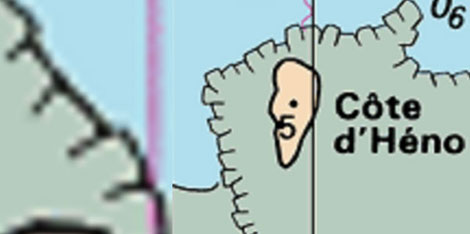
Vector charts offer the possibility to zoom while keeping a good quality of display. However, they are not more precise than Raster charts. When you zoom on one point, different adapted scales charts are loaded according to the zoom level in order to display the appropriate details (this is the case both for Raster and vector charts). If there is not enough fine scale chart to bring details, the Raster chart is going to pixelate, whereas vector charts will keep drawing fine lines. This is what is commonly called the “overzoom”. This manipulation can be dangerous because it looks like the precision of the chart is still good. Thus, some software block the zoom beyond the scale while others display the mention “overzoom”. In Adrena, when the cartography is not a priority (on a start line or near a waypoint for example), it is possible to reach this level of zoom in order to be able to see the very short distances. However, the aspect of the coast line becomes very linear and does not leave any doubt on the cartography precision.
Scale transition in Raster/CMap:
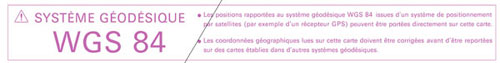
Datum of charts and of GPS, WGS84 or ED50 ?
In practice, nearly all of the SHOM charts have been calibrated and are now in WGS84. But this is still not the case everywhere… In electronic navigation, the chart datum is mentioned in its metadata, which gives to the software the possibility to apply the appropriate correction and to use jointly different Datum charts (WGS84 or ED50). However, be careful to some old or home-made charts in which the information can be wrong or not saved.
To conclude, the advantage of Raster charts is to provide charts that are similar to paper charts, which is reassuring for navigators who are used to them. They are perfectly readable by a navigation software if they are provided by editors ensuring the updates.
Our thanks to Marc Lombard (from ScanNav) for his contribution to the article.