
Description
A thorough analysis of your data
It has advanced features in many areas, for example managing your Sailect, data collection and analysis, course management, calculating polars. It enables to precise the records for a deeper performance study.
Analyzing the speeds according to every sail, drawing the Sailect charts, incrementing keel position or ballast filling, everything is possible through OptimaPro.
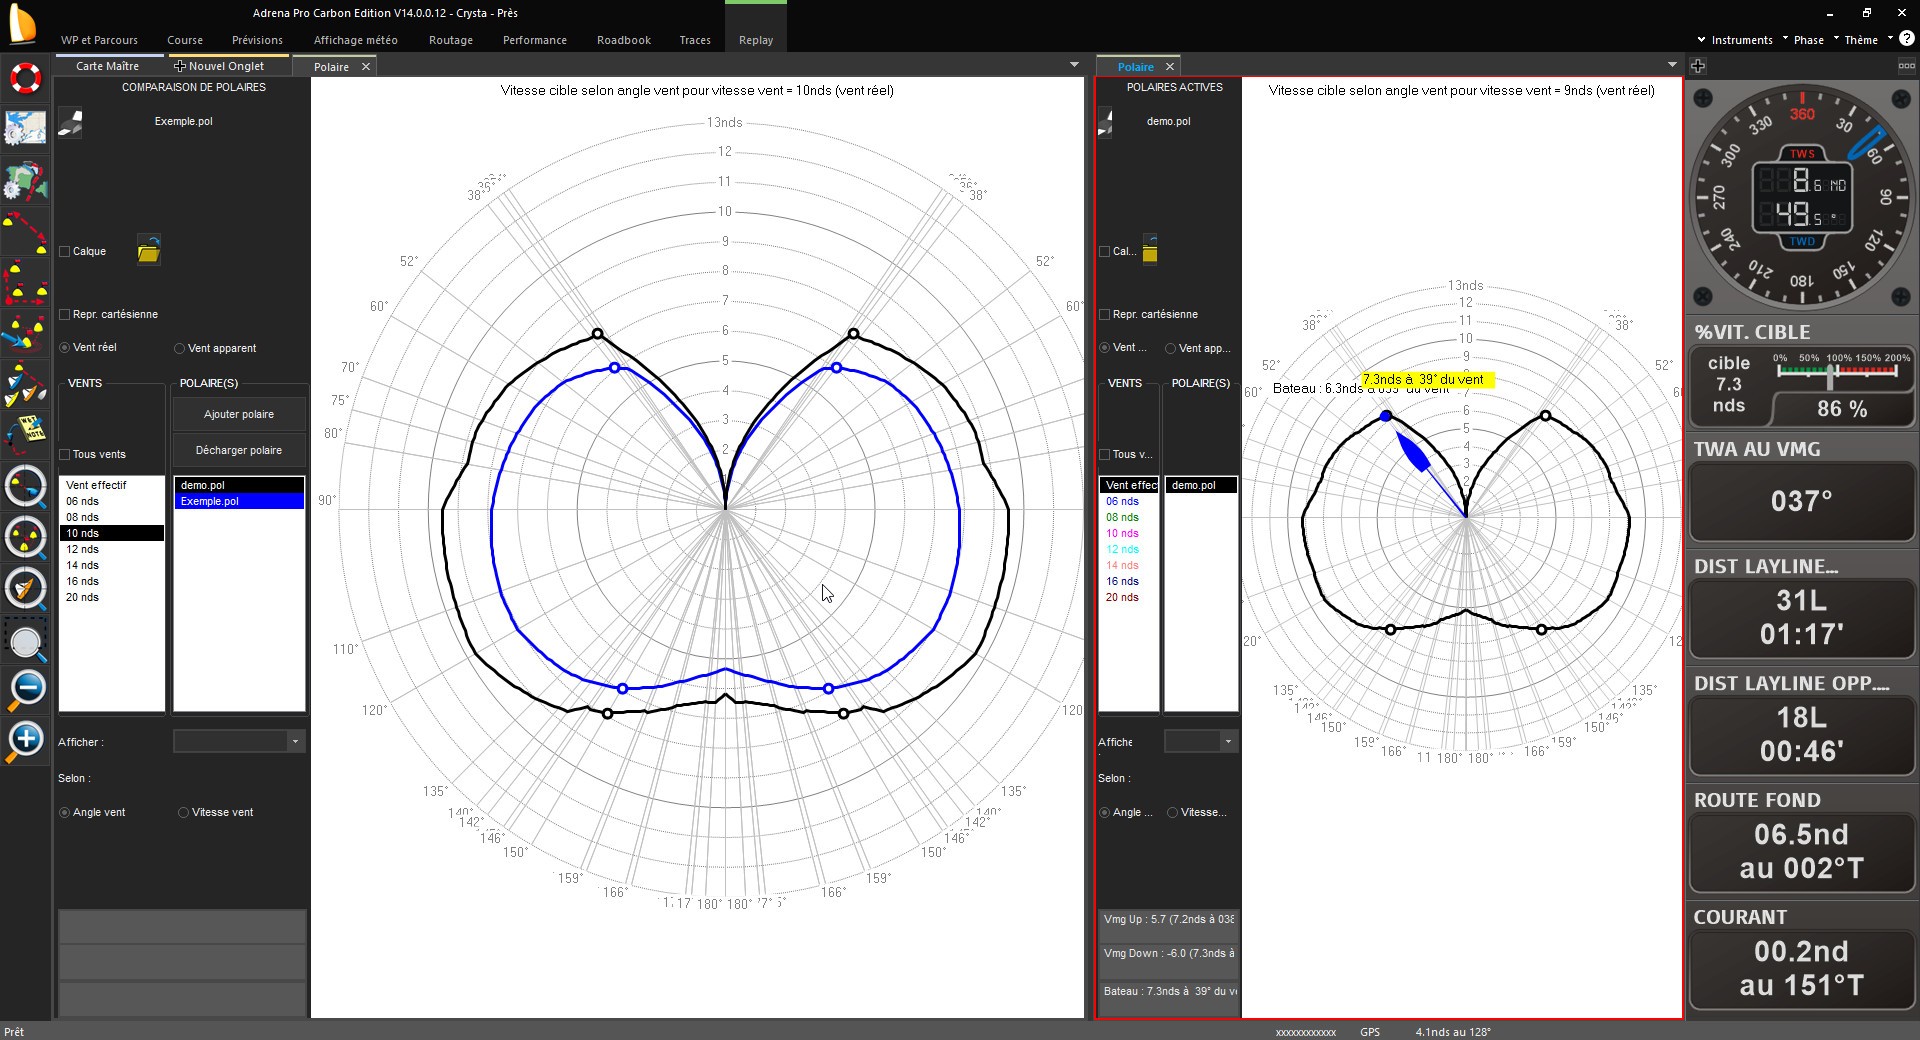
Polar charts creation
Polar calculation takes into account the boat configuration (sails, keels, ballasts…) given by the crew during navigation. Data analysis determines the most performant configurations.
Every polar file computed from these calculations can be compared and modified by overlay.
Sailect®, sail usage chart
Sailect ® files provide the software with sail range chart. for each wind force and each angle, data are analyzed and can be displayed on live or used as predicted information.
Optimization of performance in different scenarios
It is possible to make recordings in a given configuration of navigation: position of the sails, position of the appendages, how full are the ballast tanks, the type of crew… It can highlight each scenario of navigation based on a calculation of polars according to a range of variables.
The goal is to replicate the best configuration, its effectiveness or the best performance to refine the analysis.
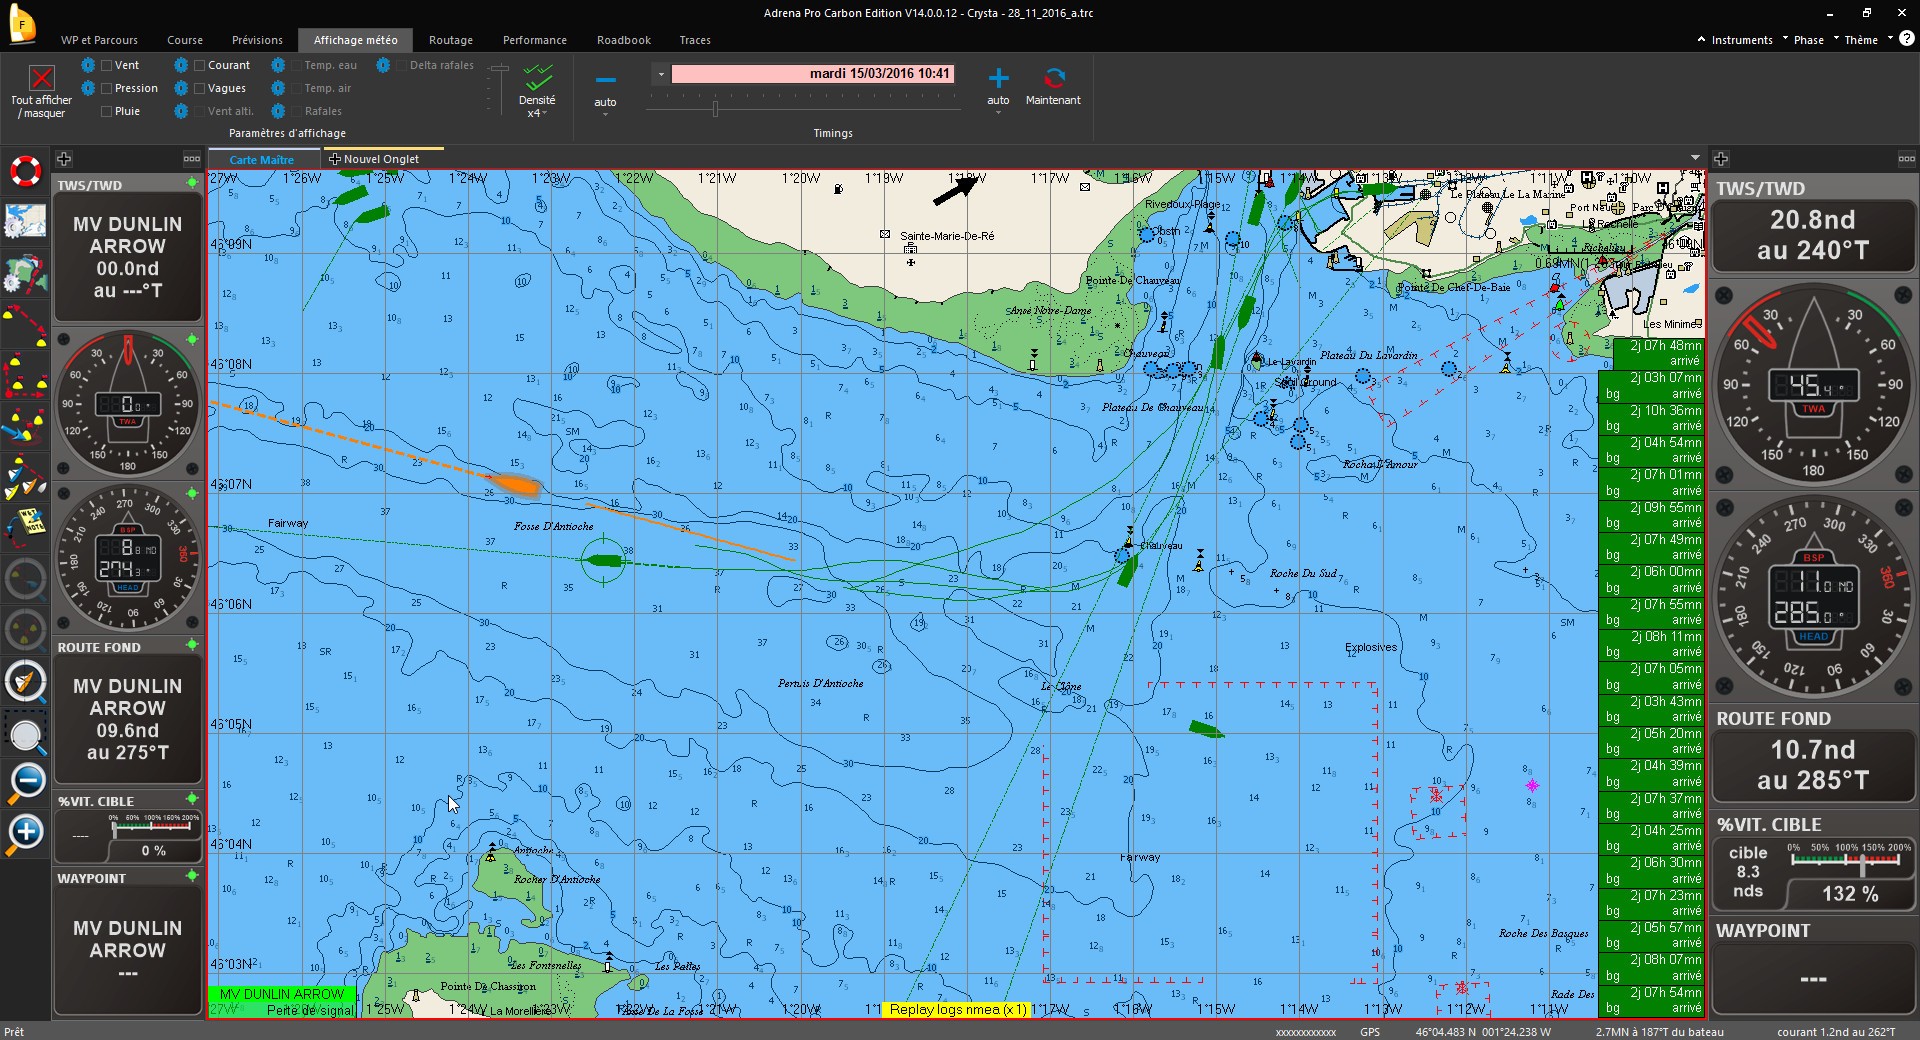
Route analysis, advanced management
The “Speed Test” and segments enable to analyze a particular section of a track in fine detail. Thanks to “Speed Test” function, it is possible to compare two sections of a track very quickly. It is also possible to divide your tracks into separate segments and to place them in a Collect file. Then, the table of segments is useful for comparison and analysis of the data.
Management options for the display of a track (color, filter thickness, management of course boundaries) enable you to highlight a data set both for on-shore analysis and for decision-making while sailing.